


Special Education in New York City: Understanding the Landscape
Information on special education in New York City is never easy to navigate. There is little quantitative data to highlight the 5W’s (who, what, where, when and why) needed to evaluate effective and quality programming. However, the Research Alliance for New York City Schools (Steinhart School, New York University) issued a report last August to examine the state of public special education in New York City. Click here to learn more.
It is one of the best analysis on how, and to whom, special education services are being provided. Understanding who students with disabilities are, and where they are being served, is fundamental to improving outcomes. This report is an eye-opening look at the current status of special education in New York City.
One of the caveats of this study is that the City’s database (Special Education Student Information System, SESIS) has faced numerous challenges, including problems with data storage, system functionality, and performance, since its launch in 2011. According to the report:
“These technical difficulties have led to incomplete and inaccurate data.”
Thus, the number of students receiving special education services could be even higher than the numbers mentioned in the report. The system is being scrapped as we speak. The study used supplemental information from demographic sources, census data, and data from the American Community Survey.
What can we learn from this study?
1. One in five students is diagnosed with a disability in New York City. That’s 20% of all students. This is, by far, the highest number ever reported in New York. (The country as a whole reports 14% of students with a disability.) Historically, the City has reported anywhere from 10% to 15% of their students having an IEP. This new high of 20% indicates the need for a radical shift in policy. If one-fifth of the student body are students with disabilities, then programming, facilities, and training need some adjustment. It is no surprise that the rates of Autism have dramatically risen over the past decade, but this still does not account for the growth in disability prevalence.
2. The most prevalent disability classifications were students with learning disabilities and speech and language impairments.These numbers are the same at the national level. According to the report, 40% of students with a disability are diagnosed Learning Disabled, and 32% are diagnosed with Speech and Language Impairments. Other classifications range between 3% to 8% (Autism is at 7%). At Cooke, Autism and Learning Disabilities are the most popular diagnoses, at about 30% each. One of the issues not cited in the report is the inconsistency with which many of these diagnoses are made. For example, diagnosing a learning disability in the school system varies from clinician to clinician. There are differing schools of thought as to what a legitimate disability is compared with other factors that may hinder learning. Correct diagnosis of school students is essential in matching them with appropriate opportunities.
3. Sixty-six percent of special education students are male. Not really surprising. Even though boys and girls are roughly split 50%/50% in the school population, boys make up two-thirds of IEP students. Boys are especially overrepresented in diagnoses of Autism, Emotional Disturbance, and Attention Deficit Disorder. I was at a lecture once where the speaker suggested that the reason why girls are not as represented in special education is because a deficit on one of their XX chromosomes can be overruled by the other chromosome. Boys do not have that luxury. A deficit on a male chromosome is not overruled because of their XY makeup. I’m not sure if that is the only reason, but it’s an interesting hypothesis.
4. Ethnicity: Black and Latino students are overrepresented in special education. The percent of NYC students with IEPs by ethnicity were: 6% Asian, 31% Black, 48% Latino and 13% White. Here is the ethnic breakdown of all NYC public school children: 16% Asian, 27% Black, 41% Latino, 15% White.
All over the country, Native American, Black and Latino students are enrolled at higher rates into special education classes. Black students are twice as likely to be diagnosed with an Emotional Disturbance. In addition, students with an IEP were more likely to live in low income neighborhoods. This is alarming, but not surprising. What are the factors at play? No one is willing to say, but one thing for certain is that bias, inaccurate assessments, environmental toxins, and lack of medical care can influence the scales. There are four questions we need to ask based on this study:
How can we improve accuracy and reduce bias in the evaluations used to diagnose disabilities?
What type of professional development and support do those conducting assessments need to ensure more accurate and culturally-responsive evaluations?
How can we increase access to appropriate health care for students with disabilities that require a medical diagnosis?
How can we support schools, families, and communities in identifying and remediating environmental factors that cause disabilities?
5. Most students with an IEP are served in community schools.
Eighty-one percent of students with an IEP are served in community school districts; 11% are served in District 75; 7% are served in Charter schools; and 4% are served in schools like Cooke. All in all, this is a good start to understanding what is going on in special education in NYC. It lacks one important point. There are no references to outcomes. There has never been any data regarding academic and social/emotional growth within New York City’s special education system. It is virtually impossible to find data supporting whether or not special education students are making any progress. This is a serious breach in accountability for the City. There is a strong need to truly understand the growth patterns of students in special education who are exempt from testing.
The most important thing about the report is how it gets used by the City. There are clearly some glaring issues with regard to the student body makeup, diagnostic information, and the delivery of services. I am shocked by the very high number (20%) of students needing special education services. How will the City respond?
Special thanks to the Cooke PSA (Parent School Association)
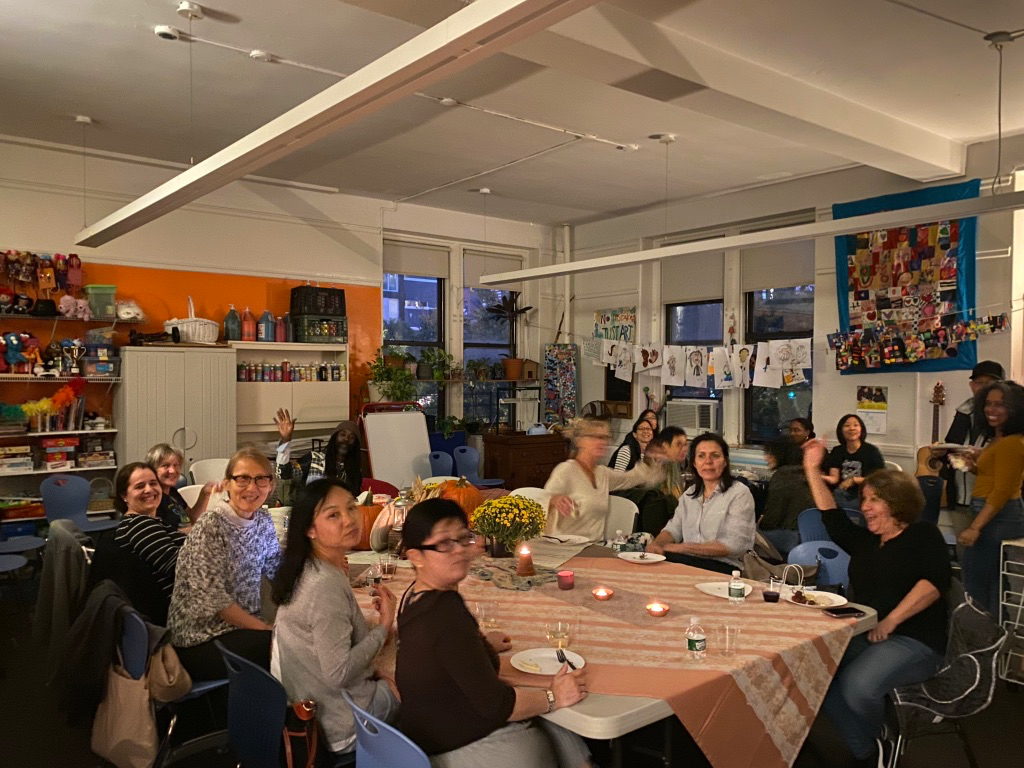
The Cooke PSA recently hosted two great events, which our families thoroughly enjoyed! The first one (on October 18th) was movie night, a favorite of students. This year, we showed a double feature which gave parents the time to socialize and enjoy each other’s company. The PSA set up a beautiful space for wine and hors d’oeuvres for the adults, while supervised students (and some parents) watched back-to-back Halloween-inspired films. There were well over 100 people in attendance. For some students it was their first time in Cooke’s “theater.” There will be another movie night in January, so stay tuned for details.
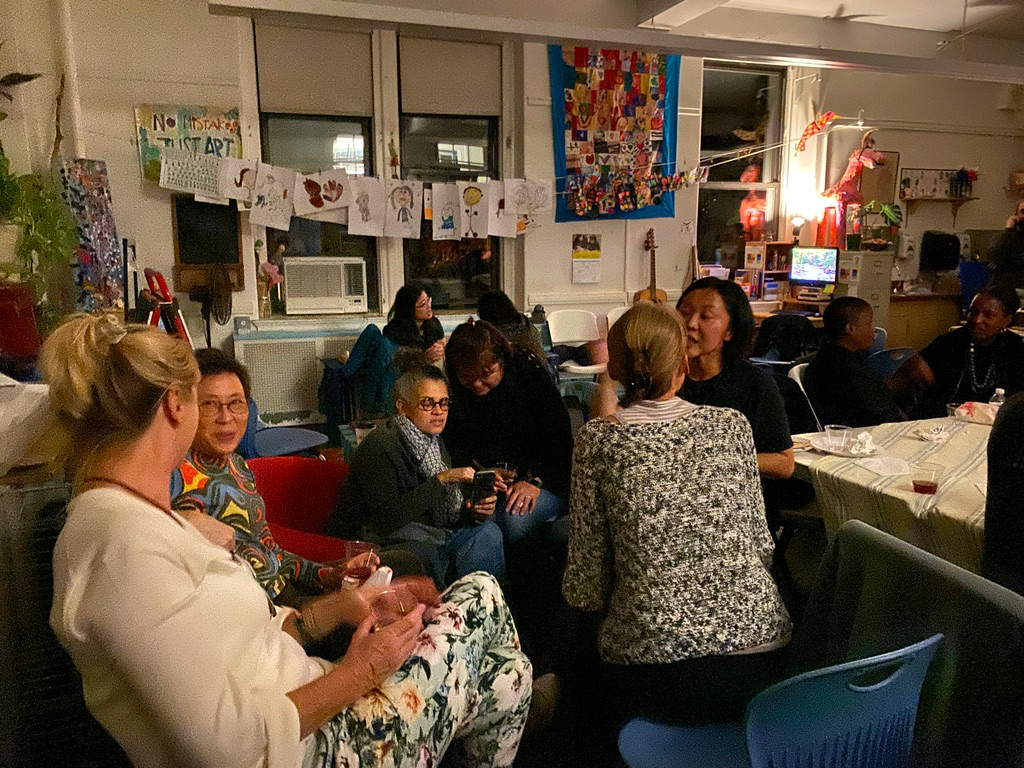
On November 1st, the PSA hosted a “Parent Outing” for high school parents whose children were attending the Fall Dance at the Academy. While students enjoyed a parent-free dance with a DJ, food, and fun, parents met at Blue Haven (near the Academy), for some food, drinks and socializing of their own!
Both events were a great opportunity for new families to meet and get acquainted. Making connections is important for our community. We value the expertise and knowledge our families have and hope to create events where this knowledge can be shared.
Our next PSA meeting will be on December 4th. We are hoping to have Ramapo for Children come to present their programming. We will also share more information about the new school building. We’re looking forward to seeing all of you soon!